
Activity Reporting: A Complete Guide & Definition

Every company runs on data. The hard part is turning that data into something you can actually use. That is the job of activity reporting: you collect data, you analyze it, and you present it in a clear form so people can make informed decisions. This guide explains what activity reporting is, why it is so crucial, and how to do it well, with simple steps and a practical example.
session
Book a free reporting audit
See how Odoo can centralize your data and turn it into clear, real-time dashboards — tailored to your teams.
Book a free sessioncontents
- 01What is activity reporting?
- 02Why activity reporting is crucial for your business
- 03How to collect data the right way
- 04Data collection: where your numbers come from
- 05How to analyze data and spot trends
- 06Working with large amounts of data
- 07How to build a clear report, step by step
- 08A simple activity reporting example
- 09Best practices to report effectively
- →Conclusion
What is activity reporting?
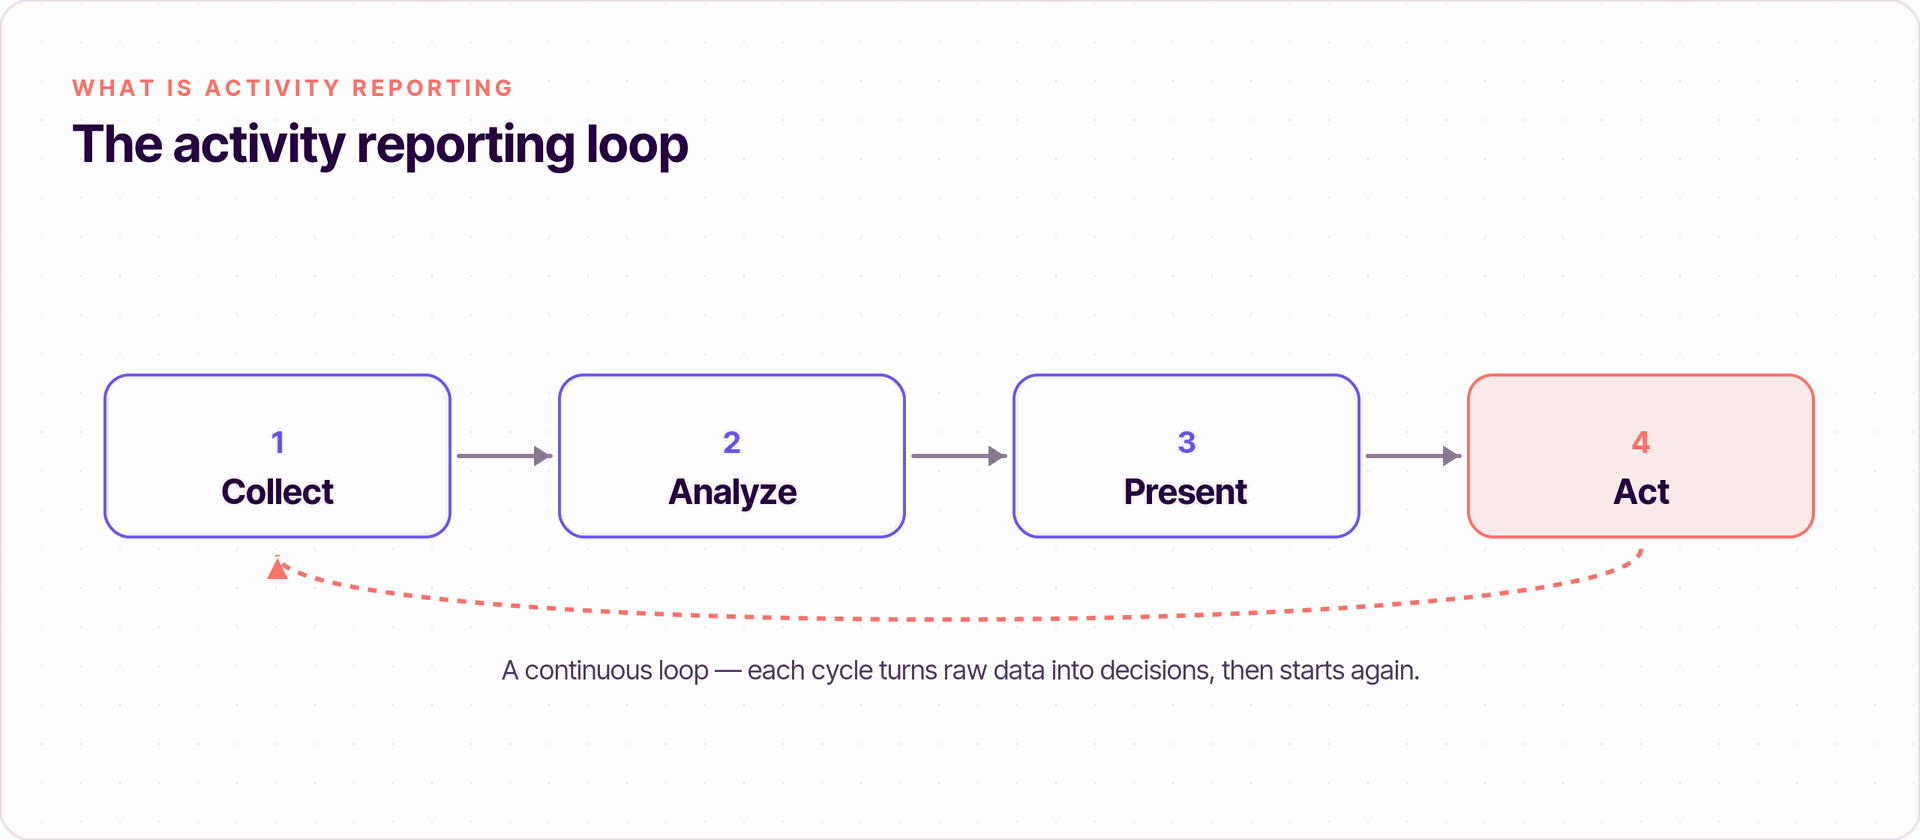
Activity reporting is the process of collecting data about what happens in your business, analyzing it, and presenting it as reports that a team can act on. In short, it turns raw data into a clear summary of performance and progress. The aim is simple: give managers and employees the evidence they need, so they stop guessing and start making informed decisions.
A good report does three things. It shows what happened in the past, it tracks progress against a plan, and it helps you identify trends early. Whether you run a small organization or a large company, reporting is how you stay aware of performance without reading every record by hand.
Why activity reporting is crucial for your business
Reporting matters because it replaces opinion with evidence. When managers can access reliable, up-to-date numbers, they make better strategies and spend money and resources where they count. Here is what strong activity reporting gives you:
- Better decisions. Reports give you facts, not assumptions, so the whole team can move in the same direction.
- Spot emerging trends. Regular reporting helps you see emerging trends early, react to market events, and stay ahead of concerns before they grow.
- Track progress and tasks. Reporting shows how tasks are completed against the plan, so nothing slips.
- Stronger collaboration. A shared report improves collaboration and communication between teams, because everyone reads the same findings.
In short, activity reporting is how a business learns from itself. The companies that report well are usually the ones that optimize fastest, because they always know where the gap between target and reality sits.
How to collect data the right way
Before you can report on anything, you need to collect data. Good data is accurate, complete, and current. If you collect the wrong numbers, every report after that carries the same errors, so this first step is crucial.
Decide what you actually need to track. For sales teams, that often means leads, appointments, sales by product, and customer accounts. For a service team, it might be tickets, response time, and customers served. Pick clear indicators, then put a simple system in place so your employees log the right information at the right time.
Data collection: where your numbers come from
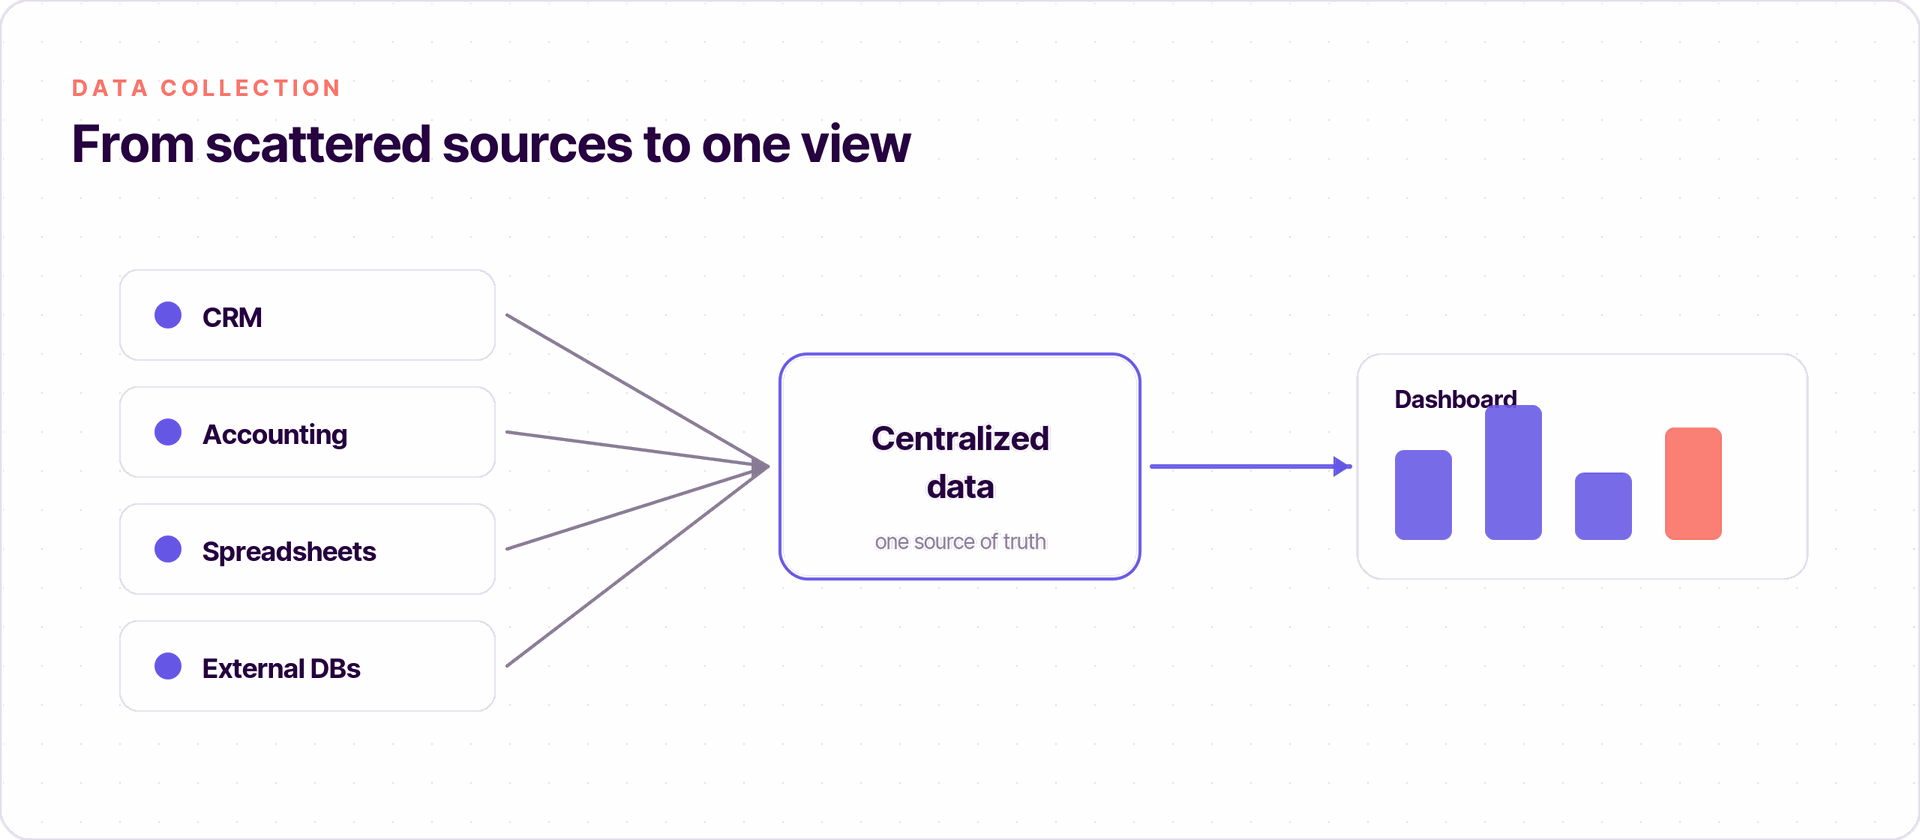
Strong data collection usually pulls from several sources at once: your CRM, your accounting tool, spreadsheets, and external databases. The goal is to bring every record into one place so you do not waste time hunting for figures. Where you can, create automatic feeds instead of manual entry. Automation lets you collect data efficiently, cuts errors, and frees your team for higher-value job tasks.
Keep a reference for each metric, so anyone can search for a number and understand it the same way. Clear definitions also help when you compare figures across teams, regions, or even a different country — and they matter when governments or auditors ask for reliable records.
How to analyze data and spot trends
Once the numbers are in, the next step is to analyze data. To analyze well, look for patterns, not just totals. Compare this period with the past, run a simple comparison between teams or products, and ask why a number moved. This is how you turn a table of figures into real understanding.
Good analysis answers practical questions. Which products bring the most money? Which leads convert best? Where is the team losing time? When you explain the findings in plain language, the audience — managers, employees, or other users — can act without needing to be data experts. That is the whole point: you analyze so others can decide.
Free session
Looking for help with Odoo reporting?
Book a free working session with a Doodex Odoo specialist and turn your scattered data into dashboards your teams actually use.
Book a meetingWorking with large amounts of data
As your company grows, you deal with large amounts of information, and manual methods break down. Handling large amounts of data by hand leads to difficulties, slow reports, and mistakes. This is where the right tools earn their place.
Modern business intelligence and ERP tools — Odoo is a good example — are developed to centralize data from every source, then present it as charts, dashboards, and tables. They let you leverage large datasets without writing code, refresh figures in real time, and give each team a view built for its job. Over time, that helps you optimize processes and use resources better.
How to build a clear report, step by step
A useful report follows a simple course of steps. Here is a practical way to write one:
- Set the aim. Decide what the report is for and who the audience is. The aim shapes everything else.
- Collect data. Gather accurate, up-to-date records from your system and databases.
- Analyze data. Identify trends, gaps, and outliers, and check the figures against your plan.
- Present the results. Use charts and tables so the data is easy to read at a glance.
- Explain and recommend. Add a short summary that says what the evidence means and what to do next.
Keep the report short, current, and honest. A clean one-page summary that people read beats a 40-page file that nobody opens.
A simple activity reporting example
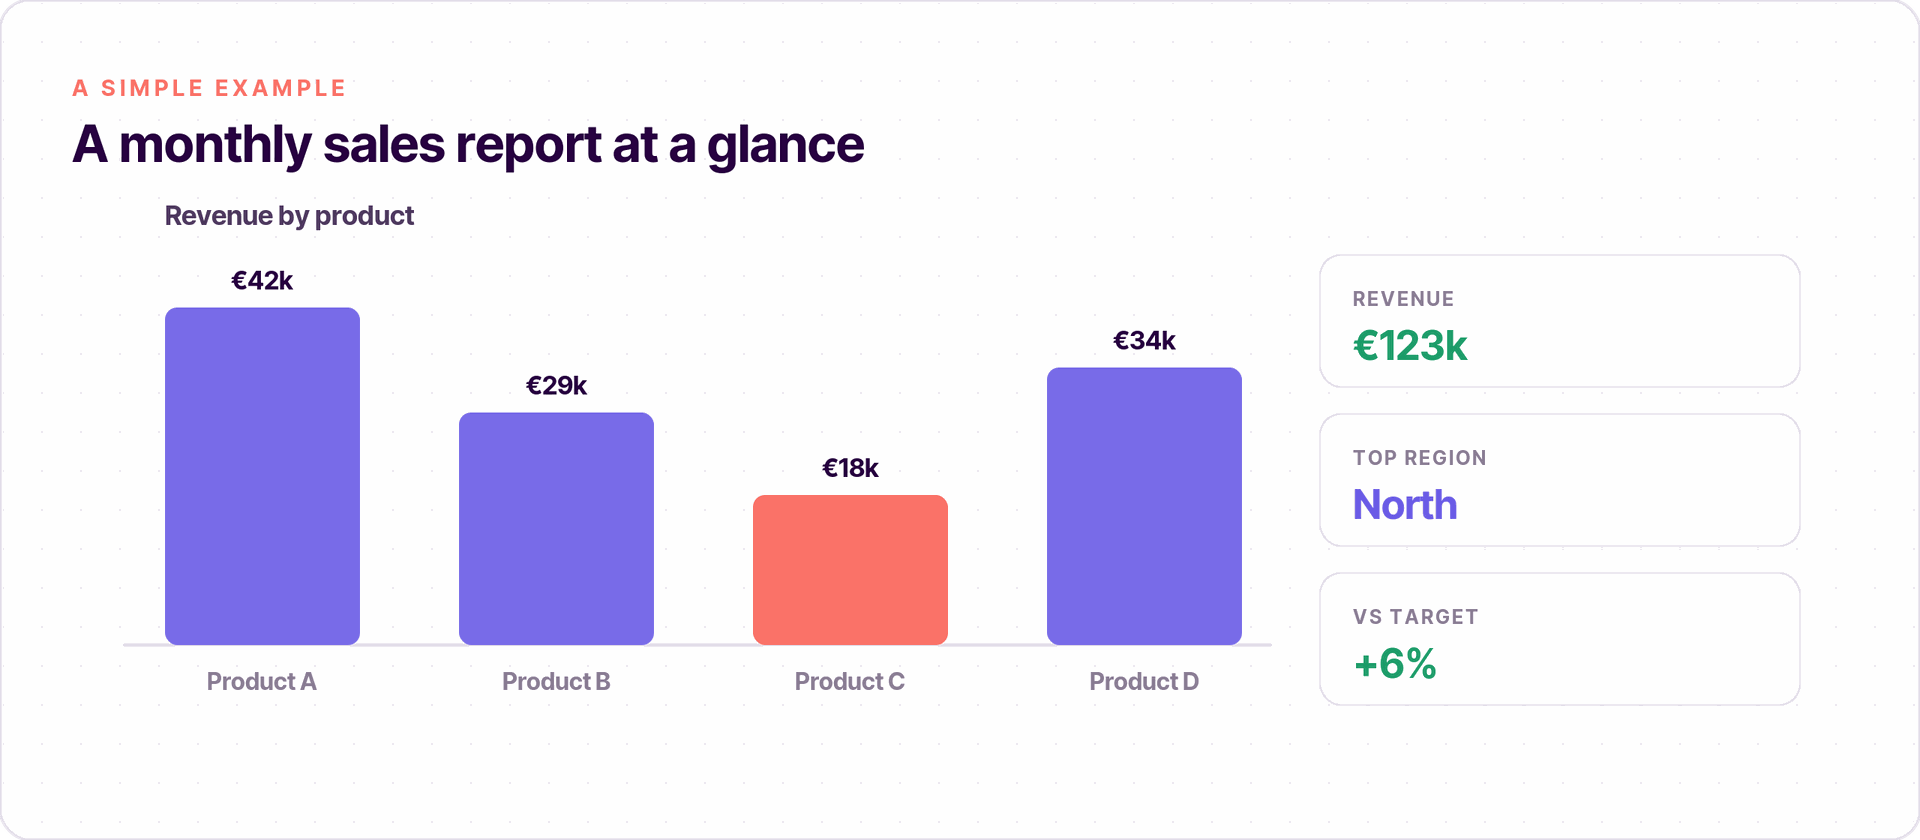
Here is an example. A retail company wants to review monitoring of monthly sales performance. The report pulls sales by product, revenue, and the results of its sales teams. The charts show which products sell best, which regions lead, and where a gap is opening. With that in hand, managers adjust their strategies, move resources, and book follow-up appointments with key accounts — all based on evidence rather than instinct.
Best practices to report effectively
- Use the right tools. Choose tools that match your needs and let your users access reports easily.
- Automate where you can. Automation saves time, reduces errors, and lets you collect and refresh data efficiently.
- Keep it accessible. Make sure the right people can access and communicate the findings quickly.
- Train your team. Help employees learn the tools so they can create and read reports with confidence.
Conclusion
Activity reporting is essentially a loop: collect data, analyze data, present it, and act. Do it well and you turn raw numbers into a clear summary that drives progress, supports collaboration, and helps your organization grow.
In financial institutions, suspicious activity reports are regulated by the Bank Secrecy Act, and this article only touches that compliance use case at a high level. SARs became the standard form for reporting in 1996.
As your data grows into large amounts, lean on a system built for it — like Odoo — so reporting stays fast, accurate, and easy to understand.
Your Odoo partner
Ready to make decisions on evidence, not guesswork?
Doodex helps you centralize your data in Odoo and build clear, automated reports - from setup to training. Talk to our team to get started.
Talk to a Doodex expertanswered
Can Odoo pull reporting data from our other tools, like our CRM or spreadsheets?
Yes. Odoo's reporting works on top of data already in Odoo (Sales, CRM, Accounting, Inventory, and more), and Doodex can also import spreadsheets or connect external systems so every source feeds one set of dashboards instead of scattered files.
Do we need technical or BI skills to build reports in Odoo?
No. Odoo lets you build list, pivot, graph, and dashboard views by point-and-click, filtering and grouping without code. Doodex sets up the key dashboards for each team and trains your staff so they can adjust and read them confidently.
Can reports update automatically and in real time?
Yes. Odoo reports reflect live data as transactions happen, so dashboards stay current without manual exports. You can also schedule reports to be emailed to managers on a regular cadence.
Can we control who sees which reports?
Yes. Access rights and record rules let you decide who can view or edit each report or dashboard, so sensitive figures such as finance or salaries stay limited to the right people while teams still see what they need.
How long does it take Doodex to set up reporting for our business?
It depends on how many sources and dashboards you need, but a focused reporting setup is usually a matter of days to a few weeks. We start from your priority decisions, build the dashboards that answer them first, then expand.