
HR Dashboard Examples: Templates, KPIs, and Best Practices

HR dashboard examples help organizations transform workforce data into meaningful insights, making them an essential part of modern human resources management. Whether you're tracking employee performance, recruitment, turnover, attendance, or other HR metrics, the right dashboard provides a clear, real-time view of your workforce and supports better decision-making.
In this guide, you'll explore practical HR dashboard examples, discover why they matter, and learn which key HR metrics and best practices can help optimize human resources management, improve employee performance, and drive better business outcomes.
session
Book a free HR dashboard session
See how Doodex can turn your scattered HR data into clear, real-time dashboards built around the decisions your team needs to make.
Book a free sessionWhat is a HR dashboard?
An HR dashboard is a visual management tool for HR analytics that compiles and presents key data relating to a company's human resources. It can include performance indicators (KPI), statistics on absenteeism, turnover, employee satisfaction, and much more, turning raw employee data into actionable insights for HR professionals. This information is crucial for HR managers because it makes it possible to monitor the state of the organization, support workplace management, help align HR strategy with business goals, and identify the areas requiring improvements.
HR dashboard example
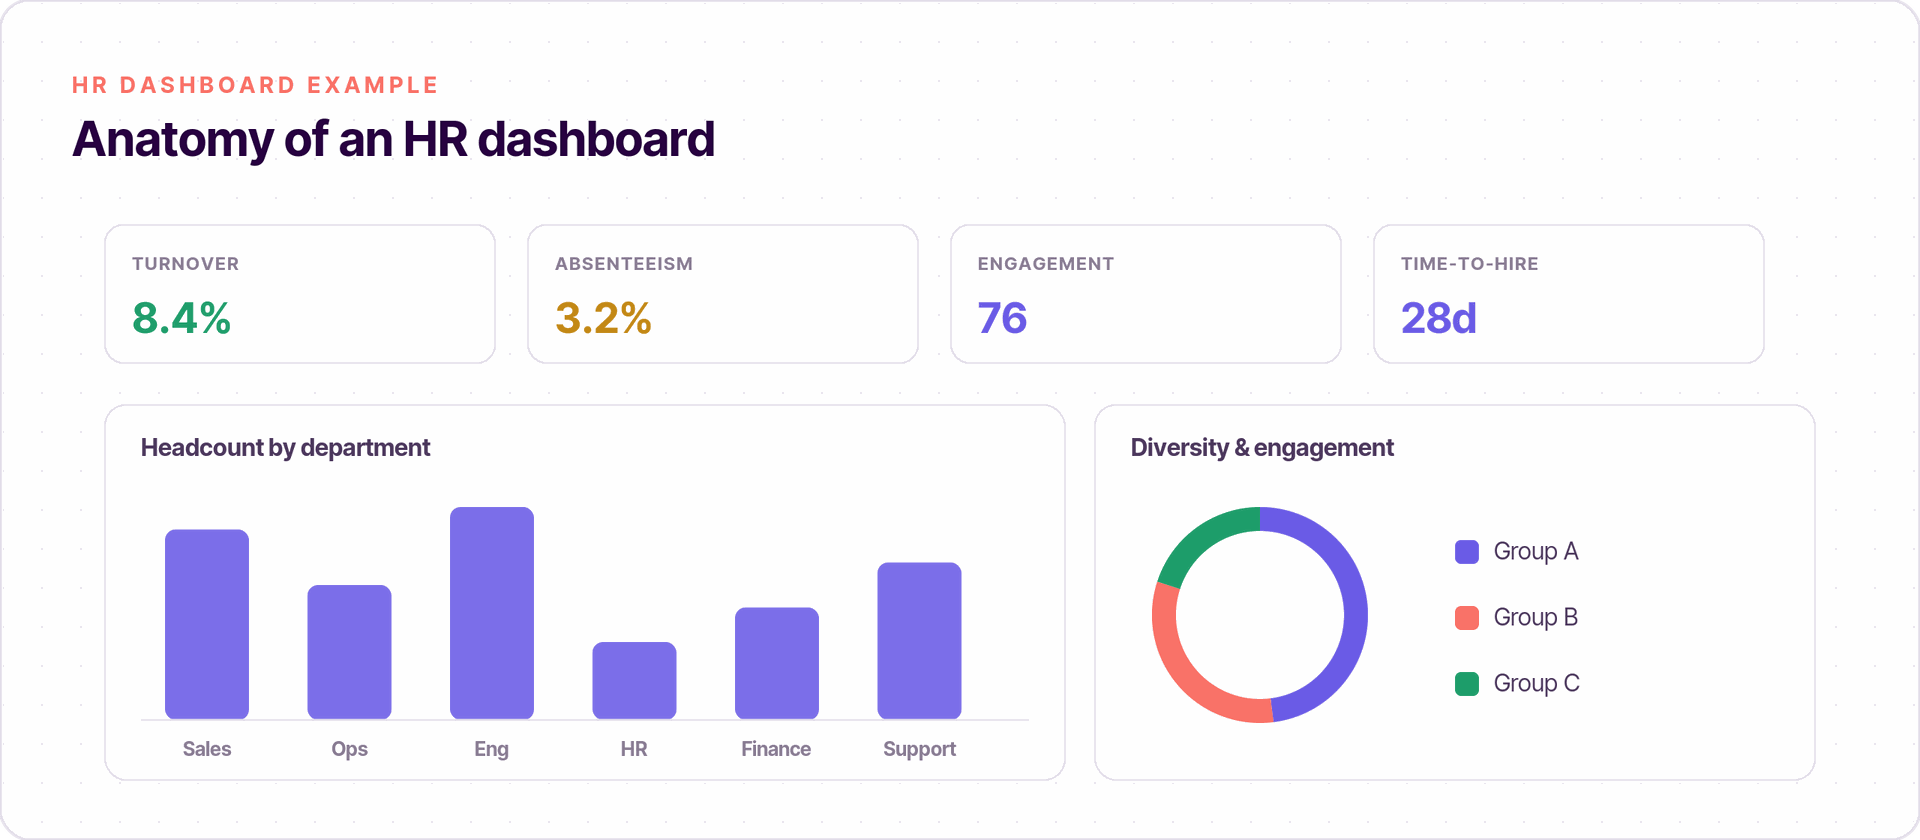
To illustrate the importance and use of HR dashboards, here is a typical example of what an HR dashboard could look like:
Key performance indicators (KPI)
An HR dashboard is a visual tool that helps teams monitor workforce trends and make faster decisions. It tracks key metrics and HR KPIs in real time, using workforce data and HR data from across the organization. It can include an HR metrics dashboard or HR analytics dashboards that surface core metrics such as employee turnover, employee engagement, employee tenure, new hires, revenue per employee, and other performance metrics. These also work well as dashboard examples for leadership views that highlight key ratios, compare results against industry benchmarks, and distinguish a live dashboard from an hr report. HR teams, HR professionals, and HR leaders use these HR dashboard KPIs to focus on the important metrics, ideally a concise set of 5-7 key metrics.
- Absenteeism
- Turnover rate
- Employee satisfaction
- Average recruitment time
- Cost per hire
- Employee engagement score
Statistics on the workforce
- Total number of employees
- Distribution by department
- Distribution by seniority
- Gender distribution
- Diversity metrics
- Engagement scores
Training and development
A development dashboard can help track learning progress and the business impact of training. Common measures include training completion rates and overall completion percentage by team or program.
- Number of training hours per employee
- Participation rate in training
- Budget allocated to training
Social dashboard
A diversity dashboard or compensation dashboard can also support broader people analysis, including pay equity and representation trends that matter to department managers as well as HR.
- Participation rate in social activities
- Employees feedback on social initiatives
- Employee commitment
Importance of HR dashboards and key metrics
The use of HR dashboards offers several key advantages:
- Informed decision-making: by viewing precise and up-to-date data, managers can make more informed decisions aligned with business goals and business objectives.
- Identification of problems: the dashboards make it possible to quickly identify problems such as high absenteeism or an important turnover, while an employee dashboard can also surface employee engagement trends and attrition risks.
- Monitoring of objectives: they help track progress in relation to the HR objectives set and support a clearer hr strategy.
- Effective communication: dashboards are visual tools that facilitate the communication of important information to stakeholders, and executive dashboards often display high level metrics for faster review.
Some common KPIs and metrics used in these dashboards include:
- Turnover rate
- Absenteeism rate
- Recruitment metrics: average recruitment time, cost-per-hire as the average financial investment required to attract and onboard a new employee, and quality of hire as a vital recruitment performance indicator.
- Average salary
- Distribution of employees by department
Workforce statistics may also include:
- Headcount trends
- Hiring and departure volumes
- Diversity metrics, with a diversity breakdown tracking the percentage breakdown of employees across demographics
Training and development metrics often include:
- Training hours per employee
- Training completion rate, meaning the percentage of employees who finish assigned training or upskilling programs
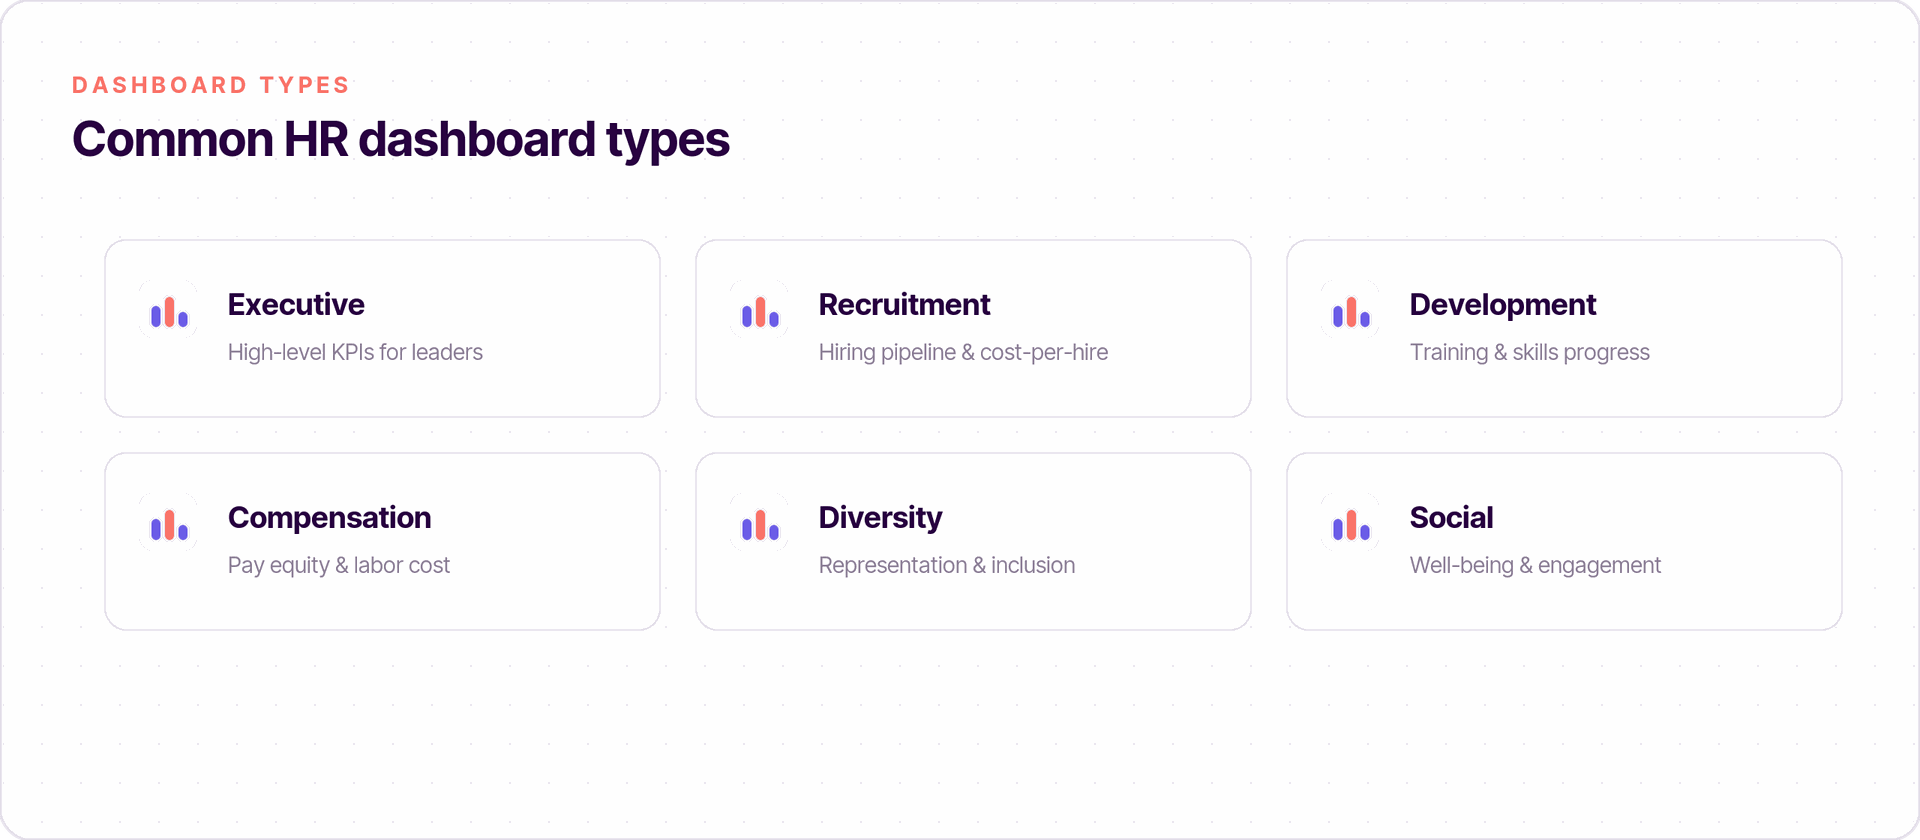
Recruitment dashboards visualize hiring pipeline and conversion rates, and the dashboard can be complemented by an HR report for deeper historical detail.
Dashboard examples also often include a compensation dashboard with labor cost per FTE and revenue per employee.
Diversity dashboards analyze representation across various demographics.
Example of an executive HR dashboard
A social dashboard is a specific subset of HR dashboards, focusing on social and well-being aspects of employees. A well-designed HR dashboard provides actionable insights that help drive people value, but it should also be tailored by audience: an executive dashboard highlights high level indicators, while an employee dashboard supports more operational users in day-to-day workplace management. Here is an example of what a social dashboard might contain:
Employee satisfaction
- Overall satisfaction rate
- Feedback on the working environment
- Improvement suggestions
Participation in social activities
- Participation rate in corporate events
- Number of social initiatives organized
- Returns to past events
Professional life / Personal life
- Satisfaction rate concerning work/personal life balance
- Telework and flexibility policies
- Well-being programs offered
These dashboards also help teams track progress against HR strategy, business objectives, and business goals. They can support employee engagement by surfacing an employee engagement score, highlighting engagement scores over time for department managers, and helping identify top talent. In more advanced setups, predictive analytics can reveal risk patterns before they affect retention or morale. A diversity dashboard may also be used to monitor diversity metrics and support DEI efforts over time.
Free session
Want help building your HR dashboards?
Book a free working session with a Doodex specialist and turn your HR data into dashboards your managers and leaders actually use.
Book a meetingHow to create an effective HR analytics dashboard?
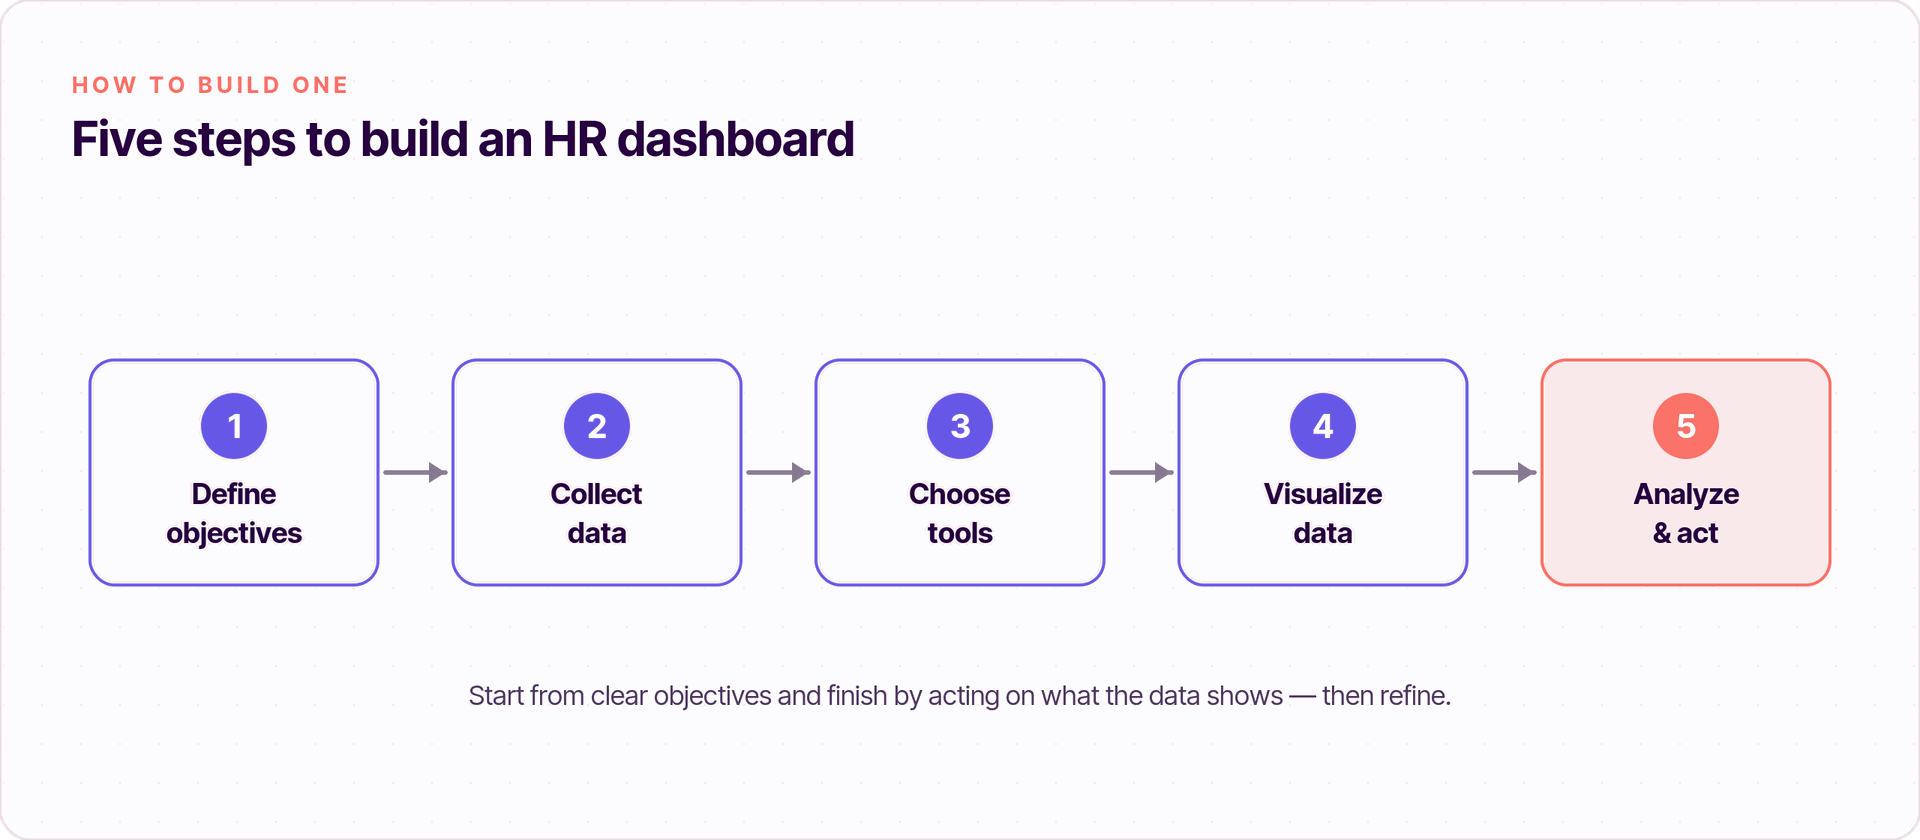
The creation of an efficient HR dashboard requires following several key steps:
- Define the objectives: identify the objectives you want to achieve with your dashboard. What KPIs are the most relevant for your organization? Clarify whether you need an hr report for historical analysis or an interactive dashboard for ongoing decisions.
- Collect data: gather the data necessary from various internal sources such as HR management systems, surveys of employees, and other data sources. The goal is to combine data from multiple systems, but this only works if data quality is consistent from the start.
- Choose the appropriate tools: use tools like Excel, Power BI or HR specific software to create your dashboards. In many cases, a business intelligence tool or an hr analytics platform will offer the key capabilities needed to build custom dashboards with real time data.
- Visualize data: present the data clearly and concisely. Use interactive charts, graphics, tables and diagrams to facilitate understanding.
- Analyze and act: analyze data to identify potential trends and problems. Put in place corrective actions based on the results.
With Odoo, two of these steps are largely handled for you: the data already lives in the system, and built-in pivot, graph and dashboard views replace separate BI tooling for most HR needs.
Useful resources
- HR dashboard examples: find inspiring dashboard examples to create your own dashboards.
- Employee dashboard: specific models to follow employee satisfaction, productivity, and attrition risks.
- Executive HR dashboard: high-level views built for fast review of key workforce metrics by senior leaders.
- Diversity dashboard: templates to track representation and inclusion metrics across teams.
- HR report: examples that show when a static summary is more useful than a live dashboard.
- HR dashboard to download: access free models to help you start.
The use of HR dashboards is an essential practice for any business wishing to remain competitive, continuously improve its human resources management processes, and support business goals with tools HR teams and HR leaders can actually use.
Building HR dashboards in Odoo
If your HR data already lives in Odoo, you do not need a separate tool to build these dashboards. Odoo's HR apps — Employees, Recruitment, Time Off, Appraisals and Payroll — all write to a single database, so the metrics covered above (turnover, absenteeism, headcount, engagement, time-to-hire) come straight from your day-to-day records, with no manual exports.
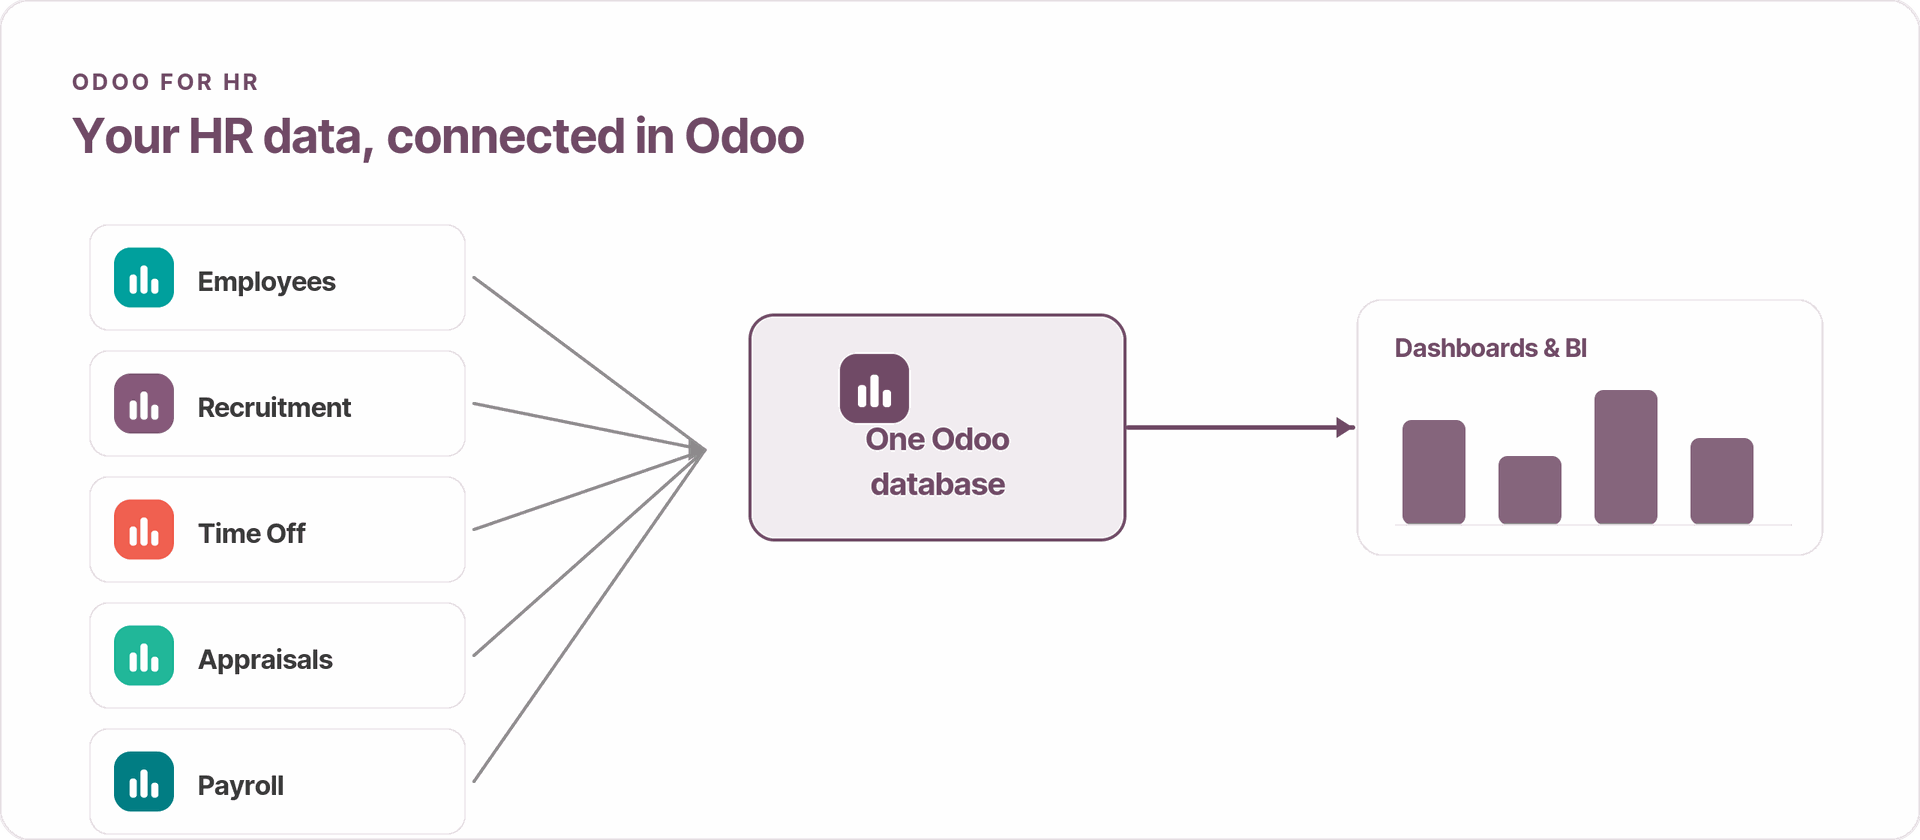
From there, Odoo turns that data into live views in a few clicks. Pivot, graph and dashboard views let HR teams group and filter by department, contract type or period, while Spreadsheet (BI) brings the same real-time data into a familiar spreadsheet for deeper analysis. Access rights keep sensitive figures — like salaries — visible only to the right people.
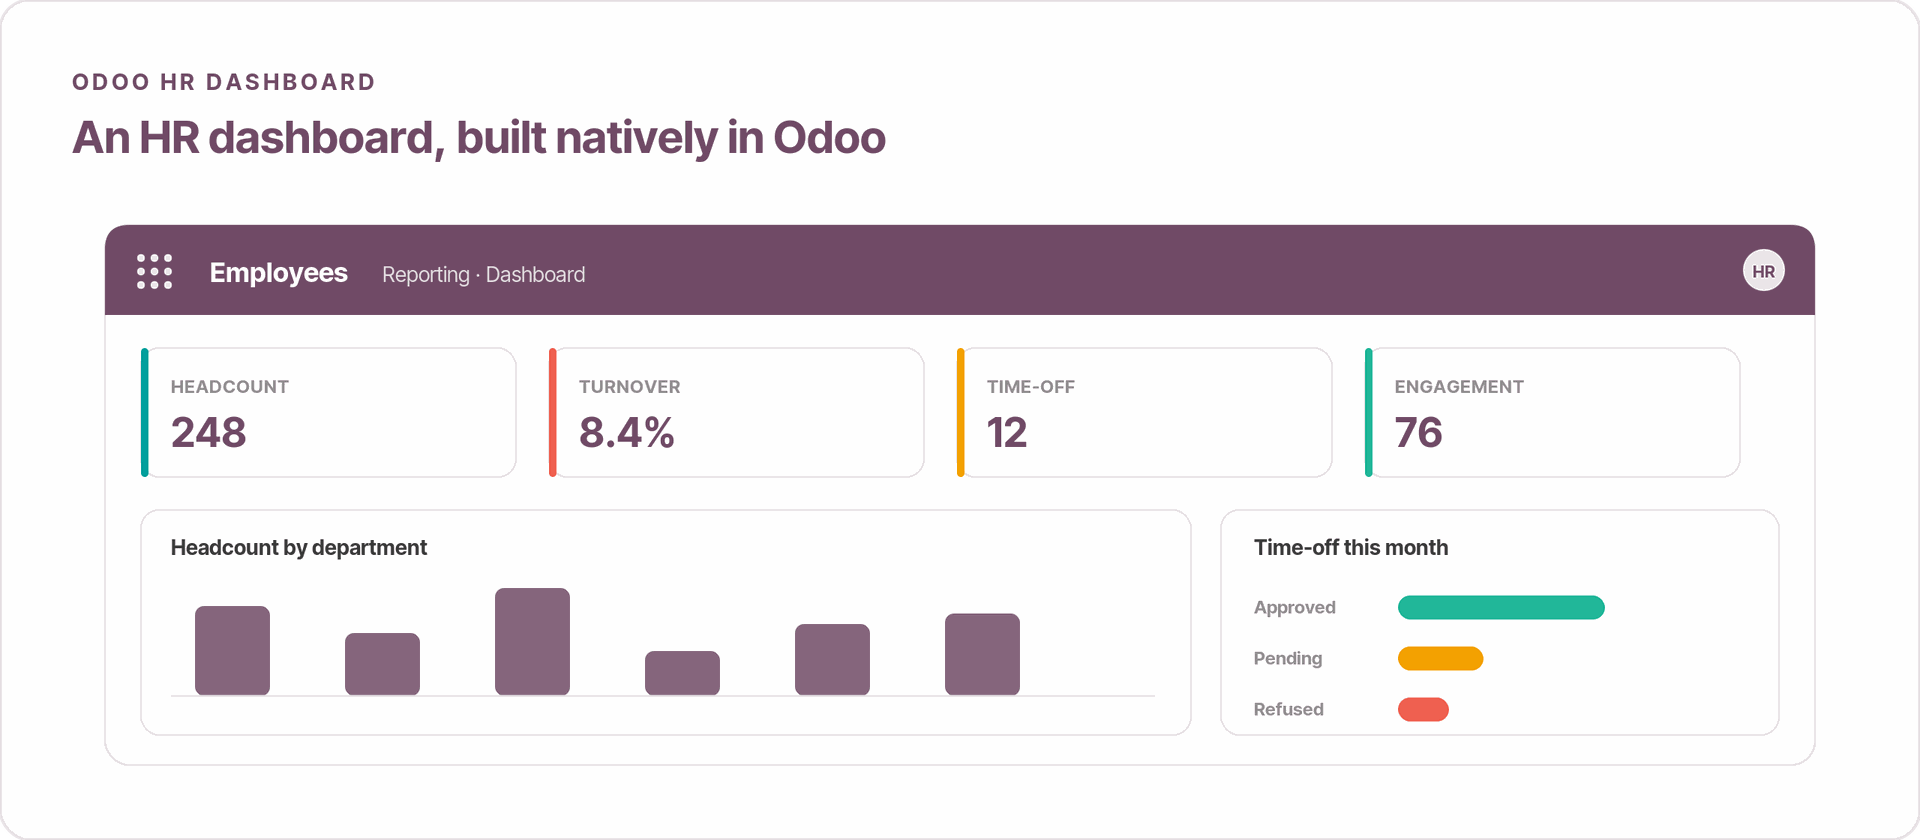
Because everything updates in real time, an Odoo HR dashboard always reflects the current state of your workforce: a new hire, an approved leave request or a completed appraisal shows up immediately — no waiting for a monthly report. That makes Odoo a practical foundation for the kind of HR dashboards described throughout this guide.
Conclusion
HR dashboards are essential tools for any organization wishing to optimize its management of human resources. By visualizing key data in a clear and concise way, they allow managers, HR leaders, and hr teams to make informed decisions, identify potential problems, and follow progress toward the objectives set and broader business goals. Whether you use free templates as a useful starting point for custom dashboards, Excel models to download for free, or the best hr dashboards in specialized software, the important thing is to create dashboards adapted to your specific needs.
- A recruitment dashboard can help you track hiring KPIs more clearly.
- A development dashboard or diversity dashboard can support workforce planning and employee growth.
- A compensation dashboard is useful for monitoring payroll and salary structure.
- A complete Excel model with interactive charts makes dashboard examples easier to use.
The right template can help minimize hiring costs and reduce time-to-hire.
Do not hesitate to explore different examples of HR dashboards and adapt them to your organization to maximize their efficiency. By investing time and resources in the creation and analysis of these tools, you will help improve the overall performance of your business and the well-being of your employees.
And if you want these dashboards to stay live without manual upkeep, building them on a connected platform such as Odoo — as shown above — is the most sustainable option.
Your Odoo partner
Ready to make people decisions on evidence?
Doodex helps you centralize HR data and build clear, automated dashboards - from KPI definition to setup and training. Talk to our team to get started.
Talk to a Doodex expertanswered
Can Odoo build HR dashboards from our existing HR data?
Yes. Odoo's HR apps (Employees, Recruitment, Time Off, Appraisals, Payroll) already hold the data, and its built-in reporting turns it into list, pivot, graph, and dashboard views. Doodex can also import spreadsheets or connect other systems so everything feeds one set of HR dashboards.
Which HR metrics should we start with?
Start with a concise set of 5-7 metrics tied to real decisions — typically turnover, absenteeism, time-to-hire, headcount by department, and an engagement score. Doodex helps you pick the KPIs that match your priorities before adding more.
Do we need a separate BI tool, or can Odoo do it?
For most HR needs, Odoo's native dashboards and pivot views are enough and stay live with your data. If you need to blend HR data with many external sources, a business intelligence tool can help — Doodex advises on the right fit for your case.
Can different teams see different dashboards?
Yes. Odoo access rights let you tailor views by audience — an executive dashboard with high-level KPIs for leaders, and more operational views for managers — while keeping sensitive data such as salaries restricted to the right people.
How long does it take Doodex to set up HR dashboards?
It depends on how many sources and views you need, but a focused HR dashboard setup is usually a matter of days to a few weeks. We start from your priority decisions, build the dashboards that answer them first, then expand.